.gif)
%20(1)%20(1).avif)
Kitchen renovations are a scheduled event, not a rare one. According to Hotel Online (August 2026), citing IBISWorld, renovations and additions accounted for $6.4 billion — 27% of hospitality construction revenue — in 2025, and higher-end resorts refresh key spaces every three to five years. The question is not whether your kitchen goes offline, but what that window costs. That is what a mobile kitchen rental ROI calculation prices — not the trailer, but the revenue that keeps running and the costs that never arrive. Here are the three inputs, the formula, and the assumptions that decide whether your number holds up.

The Financial Impact of Kitchen Downtime in Hospitality
Kitchen downtime costs more than restaurant sales. One production kitchen feeds the dining room, the bar, room service, banquets and every outlet with a hot menu, so an outage removes several revenue lines at once. Pricing that full exposure comes first.
Banquets are the visible loss because they carry contracts, but daily covers and bar attach rate sit on the same line. According to CBRE Hotels Research (November 2025), F&B revenue per occupied room grew 3.8% in the first half of 2025, against 3.0% for total hotel revenue. It is outrunning rooms — and the American Hotel & Lodging Association (2026) puts gross operating profit near 90% of 2019 levels.
Note: Build the downtime figure from every outlet the kitchen feeds, not restaurant sales alone. Our kitchen downtime cost calculator walks that exercise.
Core Components of Mobile Kitchen ROI Analysis
Mobile kitchen ROI analysis rests on three inputs: revenue preserved during the kitchen-down window, costs avoided by staying open, and the rental investment itself. Each needs its own evidence. Weak inputs are what make a return figure collapse the first time a finance committee questions it.
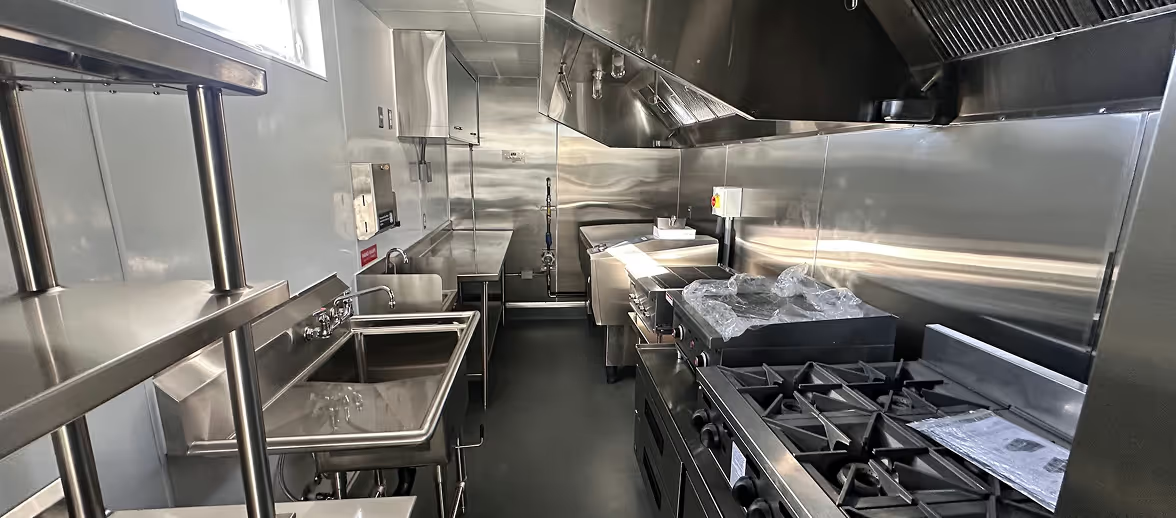
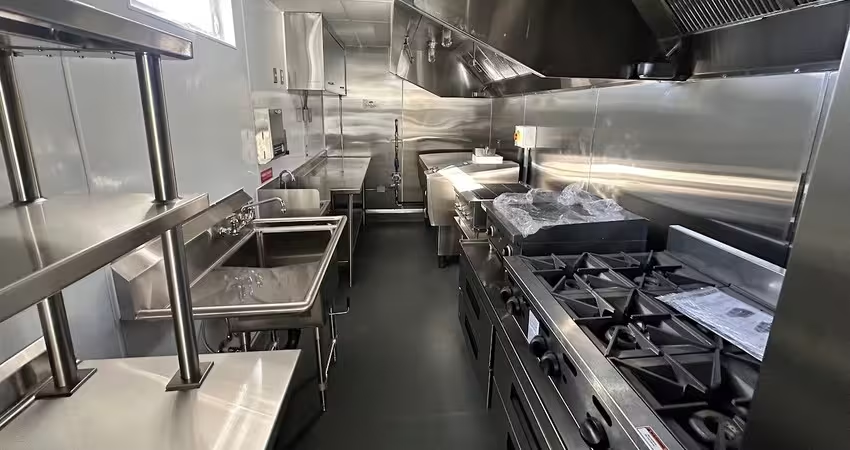
Across more than 400 units delivered, we find the deciding input is rarely the rental figure. It is how honestly the operator sets production capacity. In one five-month deployment, a 900-square-foot unit held a full menu at 400 to 500 meals a day. Smaller footprints belong lower.
Revenue Preservation Metrics
Start with your own point-of-sale data, not an industry average. Pull daily covers and average check by outlet for the same weeks last year, then add banquet revenue already contracted into the window. Nobody disputes your own history.
Now apply a capacity ratio: the share of that baseline the temporary kitchen can realistically produce. You set it, and it turns on equipment schedule, footprint and menu complexity. According to the National Restaurant Association (2026), 42% of operators reported their restaurants were unprofitable last year. Model conservatively.
Cost Avoidance Calculations
Cost avoidance is the half operators leave out, and often the larger half. Guest compensation, re-catering, penalties on banquets you cannot host: price these against your own contracts.
Staffing outlasts the project. A brigade stood down for five months is one you rehire and retrain, and that expense arrives after the construction budget has closed rather than inside it. CBRE puts labour at 59.4% of F&B costs, which is the scale of what a rebuild is working against.
Step-by-Step ROI Calculation Framework
The formula is simple; the defensibility lives in the inputs. Total the revenue you preserve and the costs you avoid, subtract what the rental costs over the full lease, then divide by that rental cost. State every assumption beside the result.
ROI = (Revenue Preserved + Costs Avoided − Rental Investment) ÷ Rental Investment × 100
Building the Revenue Model
Work outlet by outlet. Take daily F&B revenue for each affected outlet, multiply by closure days, apply your capacity ratio, then add the contracted events at risk. Model room revenue separately, and only where the property sells on its dining — a destination restaurant carries that link, select-service does not.
Then pressure-test the duration: windows slip, and a long schedule extends the revenue at risk and the lease together. Read the model against a phased renovation versus a shutdown.
Tip: Run the model twice — once at your realistic capacity ratio, once ten points lower. If it still clears at the lower figure, the number survives the finance committee.
Investment Cost Analysis
The rental investment is not the monthly rate. Build it as total cost across the lease, including the lines the quote does not carry.
| Cost category | What sits in it |
|---|---|
| Base rental | Monthly rate across the window, plus extensions |
| Delivery and removal | Transport, set, connection assistance, teardown |
| Site preparation | Decks, ramps, laydown — client-owned |
| Utility connections | Power, water, gas, waste and grease trap |
| Utility consumption | Running costs, billed to the operator |
| Permitting and inspection | Health, fire and building approvals — client-owned |
| Risk contingency | Equipment failure, downtime, re-inspection |
That last row separates the two categories. A retrofitted trailer is cheap on the first row and expensive on the last: cramped, poorly insulated, and priced for a short hire rather than a season of daily service. A purpose-built mobile kitchen carries a higher base rate and a near-empty contingency. Compare on the total — our retrofitted trailer comparison sets out the criteria — then ask Mobile Culinaire for a quote.
Critical Variables Affecting ROI Outcomes
Four variables move the result more than anything else: when in the year you take the kitchen offline, how long the lease actually runs, whether the unit can hold your menu, and how early you start the permit conversation. All four are controllable during planning.
Seasonal Demand Patterns
Timing cuts both ways. Peak-season work puts more revenue at risk, which raises the return on protecting it; going off-peak lowers exposure but risks a slipped schedule reaching your busiest weeks. Property type matters too: CBRE Hotels Research reports first-half 2025 banquet revenue up 8.7% at resorts while convention hotels fell 7.3%.
Operational Complexity Considerations
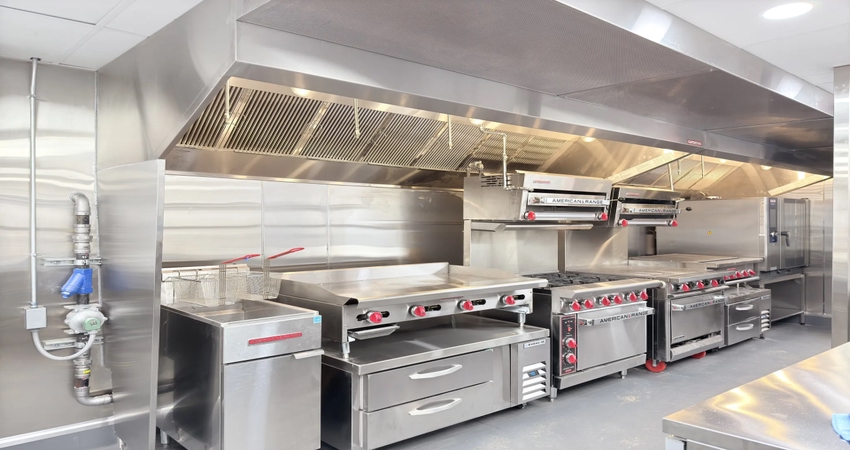
Menu scope is a revenue assumption wearing operational clothing. If the unit cannot hold your cooking line, the capacity ratio drops and the model should say so. Working conditions stop being soft factors: a poorly ventilated retrofit in August produces slower service and shorter tempers, and both show up in covers.
Regulatory and Compliance Factors
Permitting is the variable most likely to extend your timeline, and it is the operator's to own. Requirements vary by state, county and locality, so contact the local Health Department, Fire Marshal and Building Department during planning; expect an inspection once the unit is set. NFPA 96 governs ventilation and fire protection for commercial cooking. A third-party-inspected unit smooths that — the permit still sits with you.

Comparing Mobile Kitchen ROI Across Different Scenarios
The same formula produces very different returns depending on why the kitchen is offline. Planned renovations give you the cleanest inputs. Emergencies give you the starkest comparison. Multi-month seasonal capacity is a different calculation entirely — incremental revenue rather than protected revenue.
Renovation Projects
Renovations give the most defensible model, because the duration is planned. Understand rental terms and extension clauses before signing — a slipped completion date is the commonest cause of an overrun.
Emergency Replacements
A fire, flood or failed cooking line compresses the decision to days. The inputs are rougher, and site readiness decides how fast a unit is set. Map your utility connections before you need them.
Seasonal Capacity Expansion
Seasonal use weighs new covers against the lease, not losses avoided. The minimum lease is one month, with permitting on top — so this works for a season, not a weekend.
Conclusion
A mobile kitchen rental ROI calculation converts a line item into a revenue-protection decision. The version that gets approved is the one whose assumptions survive questioning: build it from your own sales history, set the capacity ratio conservatively, price the rental as total cost across the lease.
What the model prices is continuity — your full F&B operation running through a window where it otherwise would not. Carry the hidden costs of a shutdown on the other side of the ledger, see how Mobile Culinaire configures for a hotel or resort, then run your exposure through our revenue loss calculator.
Disclaimer
Permitting, health, fire and building requirements for temporary kitchens vary by state, county and municipality, and jurisdictions adopt different editions of the applicable codes. Market figures cited here change over time. Confirm every requirement with your authority having jurisdiction before committing to a window.
People Also Ask
Four questions come up in almost every ROI conversation. Two of them ask for a single number, and the honest answer is that no credible one exists. What exists is a method you can run against your own operation and defend line by line.
What is the typical ROI for renting a mobile kitchen during renovations?
There is no typical figure, and anyone quoting one is guessing. The result depends on daily F&B revenue across all outlets, closure length, the capacity ratio the unit can hold, and your quoted rental cost over the lease. Two properties with identical rentals produce very different returns.
How do you calculate the cost savings of mobile kitchen rentals versus shutdown?
Compare two scenarios over the same window. The shutdown case is lost F&B revenue across every outlet, plus contract penalties, guest compensation, and the cost of standing down and rehiring your team. The rental case is that window with a capacity ratio applied, less the total lease cost.
What factors affect mobile kitchen rental ROI for hospitality operations?
Four factors dominate: daily F&B revenue across all outlets, closure duration, the production capacity of the unit, and seasonal timing. Site readiness, permitting lead time and the equipment schedule matter secondarily. Properties with high daily covers, long windows, or a closure landing in peak season see the strongest case.
Do mobile kitchens provide positive ROI for seasonal hospitality operations?
Sometimes, and the calculation differs. Seasonal use is incremental revenue — covers you could not otherwise sell — rather than protected revenue, so the model weighs new sales against the lease rather than losses avoided. It works where the surge runs for months, not for short events.

Testimonial

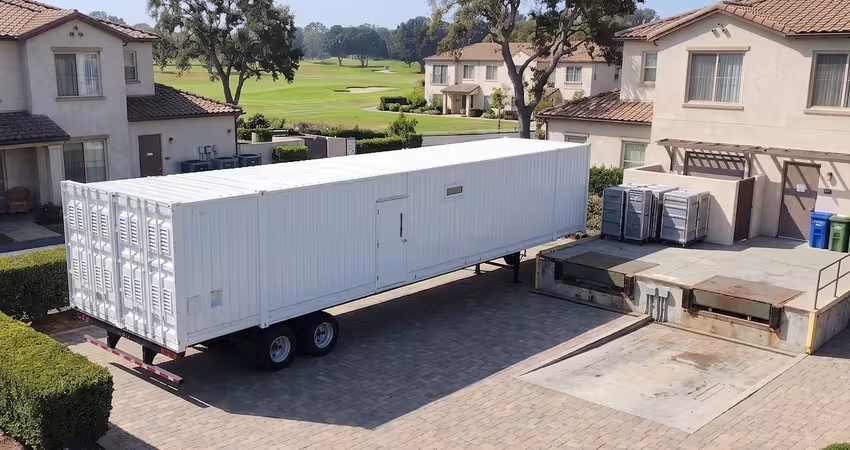
"What is standing out when you look at the mobile kitchen operation is the efficiency that we can really achieve because it's built for that."
Tell us about your kitchen needs and request a quote.
.png)
Turnkey mobile kitchen
Proudly made in-house in the USA
Commercial grade kitchen equipment
Code-compliant
Trusted by Industry Leaders