Kitchen Renovation Revenue Loss Calculator
Estimate what a commercial kitchen renovation really costs you. Enter covers, check average & downtime to see total revenue at risk in seconds.

How We Built The Commercial Kitchen Shutdown Calculator (2026)
Navigating the financial impact of a commercial kitchen shutdown or renovation can be overwhelming. Most facilities underestimate closure costs by three to five times, and without a clear picture of revenue at risk, decision-makers struggle to compare closing completely versus using a temporary mobile kitchen. That's why we built a comprehensive, interactive revenue-loss calculator that turns your operation’s key numbers into actionable estimates. In this article, we explain how we constructed the Commercial Kitchen Shutdown Calculator, the methodology behind its revenue and scenario logic, and how it delivers personalized impact estimates for hotels, resorts, country clubs, golf courses, universities, and restaurants.
⚠️ Important Disclaimer
This tool provides estimates only. Actual revenue, costs, and operational outcomes depend on many factors not captured here, including seasonality, market conditions, labor costs, contractual obligations, and unforeseen delays. The calculator is for planning and comparison purposes and should not be used as the sole basis for financial, operational, or investment decisions. This tool does not constitute financial, legal, tax, or professional advice. Always verify figures with your own data, finance team, and advisors. Rental costs, lead times, and availability vary by provider and location. We recommend obtaining formal quotes and consulting with qualified professionals before committing to renovation timelines or temporary kitchen solutions.
Tool Overview & Objectives
The Commercial Kitchen Shutdown Calculator was designed to solve a critical pain point: helping hospitality operators quickly quantify how much revenue is at risk when their kitchen is closed, and how much of that revenue could be protected—and at what cost—with a temporary mobile kitchen.
Core Objectives
The tool aims to:
- Estimate total revenue at risk over the renovation period based on daily covers, average check, days open, and optional catering
- Model revenue lost if closed by applying a user-selected percentage (100%, 75%, or 50%) to reflect full closure or partial workarounds
- Compare scenarios by showing revenue retained with a temporary kitchen, total rental cost, and net revenue protected
- Surface ROI so decision-makers can see how much revenue is protected per dollar spent on a temporary kitchen
- Support multiple operation types (hotel, resort, country club, golf course, university, restaurant) with the same calculation framework
- Collect user information to deliver a detailed impact report and personalized follow-up where applicable
Calculation Logic
The heart of the tool is its revenue and scenario engine, which converts operational inputs into revenue-at-risk, loss, and protection estimates.
Revenue at Risk
Revenue at risk is the total F&B revenue you would have earned over the renovation period if the kitchen were fully operational. The tool computes it as follows:
- Daily revenue = Average daily covers × Average check per guest
- Weekly revenue (dining) = Daily revenue × Days open per week
- Weekly revenue (total) = Weekly dining revenue + (Catering/events revenue per month ÷ 4.33)
- Revenue at risk = Total weekly revenue × Estimated renovation duration (weeks)
This represents the baseline exposure: the amount of revenue that could be lost if the kitchen is closed and no alternative is in place.
Revenue Lost If Closed
Not every operation loses 100% of revenue when the kitchen is down. Some can run a limited menu, use another facility, or outsource catering. The tool lets users choose:
- 100% – Complete closure (no F&B from the affected kitchen)
- 75% – Partial operations possible (e.g., limited service or alternate venue)
- 50% – Significant outsourcing or alternate capacity available
Revenue lost (if closed) = Revenue at risk × (Selected percentage ÷ 100)
An optional reputation & member attrition risk checkbox adds an approximate 15% uplift to the lost-revenue figure to reflect soft costs such as member churn, brand impact, and event cancellations. This is an illustrative multiplier only and not a guarantee of actual impact.
Revenue Retained with a Temporary Kitchen
When a temporary mobile kitchen is used, operations typically retain a high share of normal revenue. The tool asks for an estimated % revenue retained with temporary kitchen (slider, default 95%).
Revenue retained = Revenue at risk × (Revenue retained % ÷ 100)
This represents the revenue you keep by staying open with a temporary solution.
Temporary Kitchen Cost and Net Revenue Protected
Users enter an estimated rental cost of the temporary solution ($/month) (default $8,500).
The tool assumes a simple monthly rental over the renovation period: Total rental cost = (Renovation weeks ÷ 4) × Monthly rental cost
Net revenue protected = Revenue retained − Total rental cost
This is the amount of revenue you keep after paying for the temporary kitchen. The tool also displays an ROI-style ratio: net revenue protected ÷ total rental cost (e.g., “For every $1 spent on a temporary kitchen, you protect $X in revenue”).
How the Three-Step Flow Works
The tool is organized into three steps:
- Operation profile – Operation type, average daily covers, average check, days open per week, estimated renovation duration (weeks).
- Revenue structure – Food vs. beverage share of total F&B, optional catering/events revenue per month, and percentage of revenue lost if closed (100% / 75% / 50%).
- Alternative scenarios – Ability to run a reduced menu (yes/no), percentage of revenue retained with a temporary kitchen, monthly rental cost for the temporary solution, and optional soft-cost adjustment.
Results show total revenue at risk, estimated revenue lost if closed, potential revenue protected with a temporary kitchen, and the ROI ratio. After email capture, a detailed report breaks out daily revenue, weekly revenue, total rental cost, and net savings.
Operation Types & Revenue Structure
The calculator supports seven operation types: Hotel, Resort, Country Club, Golf Course, University / Institutional, Restaurant, and Other. Operation type is used for context and messaging; the same formulas apply to all. This ensures that whether you run a hotel banquet kitchen or a clubhouse restaurant, the logic stays consistent and comparable.The revenue structure step captures how your F&B revenue is split (food vs. beverage) and whether you have meaningful catering or events revenue. Including catering ensures that revenue at risk reflects total F&B exposure, not only à la carte dining.
Results & Impact Analysis
The tool presents three headline numbers:
- Total revenue at risk – Over the renovation period, based on your inputs.
- Estimated revenue lost if closed – Without a temporary kitchen, using your chosen loss percentage and optional soft-cost adjustment.
- Potential revenue protected – Net of temporary kitchen cost (revenue retained minus total rental cost).
The detailed impact analysis (after email submission) includes daily revenue, weekly revenue, total rental cost, and net savings, plus a breakdown of revenue at risk, revenue lost, revenue retained, temporary kitchen cost, and net revenue protected. This supports internal planning, board presentations, and comparison with quotes from temporary kitchen providers.
Why This Approach Works
The calculator turns a complex set of variables—covers, check average, days open, renovation length, revenue mix, closure scenario, and temporary kitchen cost—into a single, comparable view. By asking a short series of operational and scenario questions, it produces estimates that would otherwise require spreadsheets and assumptions.
The methodology is transparent: revenue at risk is derived from your stated volume and check; loss and retention percentages reflect your own judgment about closure impact and temporary kitchen performance. The default rental cost can be replaced with a real quote, so the “revenue protected” and ROI figures become a practical basis for deciding whether to close, partially operate, or rent a temporary kitchen.
Conclusion
The Commercial Kitchen Shutdown Calculator is a planning tool that helps hospitality operators quantify revenue at risk during a kitchen shutdown or renovation and compare the economics of closing versus using a temporary mobile kitchen. By combining clear inputs (operation profile, revenue structure, and scenarios) with consistent calculation logic, it delivers personalized impact estimates in minutes.
For hotels, resorts, country clubs, golf courses, universities, and restaurants, this tool provides a starting point for understanding financial exposure and the value of temporary kitchen solutions. It should be used alongside your own data, finance and operations teams, and professional advisors when making decisions.
⚠️ Final Reminder
Estimates only. Actual revenue, costs, and outcomes depend on many factors. This tool is based on the inputs you provide and simplified assumptions (e.g., linear weekly revenue, fixed monthly rental). It does not constitute financial, legal, or professional advice. Always verify numbers with your own systems and consultants, and obtain formal quotes from temporary kitchen providers before making operational or financial commitments.


Tell us about your kitchen needs and request a quote.
.png)
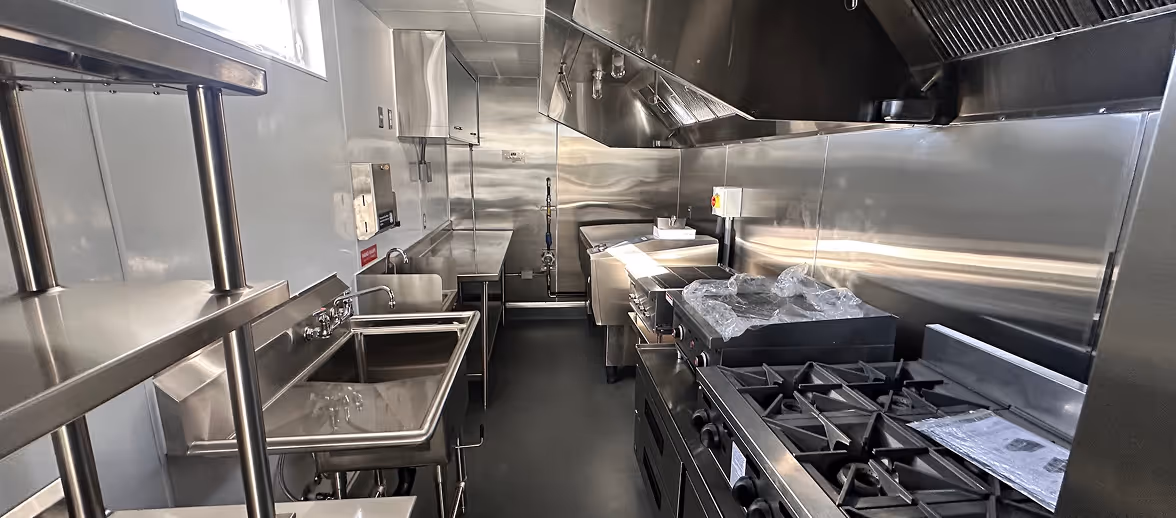
Turnkey mobile kitchen
Proudly made in-house in the USA
Commercial grade kitchen equipment
Code-compliant
Trusted by Industry Leaders