.gif)
What does one dark day in your kitchen actually cost — not the obvious line item, but the full number your P&L doesn't show you until the quarter closes? For hotels, resorts, and private clubs planning a renovation, that question usually gets answered too late, after the budget's already set and the timeline's already slipping.
This kitchen downtime cost calculator walks through the actual formula — daily revenue exposure, margin impact, and the multipliers most teams miss — so you can build the number into your renovation plan instead of discovering it afterward.
What a Single Day of Kitchen Downtime Actually Costs
Every day a hotel or resort kitchen sits dark during renovation, the revenue meter doesn't just pause — it runs backward. Direct F&B losses are the visible part. Underneath sit staff attrition, guest defection, and reputation drag that keep showing up in P&L statements months after the ribbon-cutting.
According to the National Restaurant Association, full-service restaurants operate on pre-tax margins in the low single digits — typically 3–5%. Hotel F&B departments, tracked in benchmark reporting from the American Hotel & Lodging Association, operate on similarly thin structural margins after labor and product cost. The daily revenue loss during a shutdown isn't cushioned by fat operating margins that can absorb the hit. Every closed day is close to a pure hole.
The formula below is intentionally conservative. It calculates known exposure using inputs any F&B controller already has on hand — daily revenue, operating margin, and renovation duration. If your renovation plan doesn't quantify these three numbers before ground breaks, you're building a budget on assumptions.

The Revenue-at-Risk Formula: Three Inputs You Need
The base calculator relies on three inputs. Any hospitality operator planning a renovation should be able to pull these numbers from an existing P&L within an hour.
Average Daily F&B Revenue
Pull the trailing 12 months of F&B revenue from your POS or property management system, then divide by 365. Twelve months smooths seasonality. Resorts and country clubs with strong seasonal skew should also calculate a peak-season daily average separately — if the renovation intersects peak months, that's the number that matters.
Operating Margin Percentage
This is F&B operating income divided by F&B revenue, expressed as a percentage. Industry benchmarks from CBRE Hotels Research and revenue-per-available-room data tracked by STR show hotel F&B department margins clustered in a defined band, but property-specific numbers vary widely with service model. Use your own historical figure, not an industry average — an outsourced coffee shop and a full banquet operation produce very different margins on the same revenue.
Renovation Duration (Direct + Buffer Days)
This is where most calculations understate exposure. Renovation timelines slip. Reporting from Construction Dive shows hospitality construction projects routinely run 15–25% past initial schedule due to supply chain, permitting, and inspection delays. Take your contractor's stated duration, add a buffer that matches your risk tolerance (20% is a common working figure), then add the post-completion ramp-up period during which the kitchen is operational but not at full menu capacity. Our commercial kitchen renovation timeline guide breaks down typical phase durations for each renovation type.
The base formula:
Direct Revenue Exposure = Average Daily F&B Revenue × Operating Margin × Total Downtime Days
This is your floor. It captures what you'd lose if the kitchen sat dark and nothing else happened. The multipliers below explain why the floor almost always understates the total exposure.
Beyond Direct Loss: The Multipliers Most Calculations Miss
The base formula assumes revenue is the only variable. In practice, three second-order effects compound the loss, and any credible view of restaurant revenue loss during renovation has to account for all three.
Staff Turnover and Replacement Cost
When a kitchen closes, staff don't wait patiently for reopening. Line cooks and prep staff move to competitors, and front-of-house scatters when there's no menu to sell. U.S. Bureau of Labor Statistics JOLTS data shows accommodation and food services with among the highest quits rates of any sector — routinely above 4% monthly even in stable conditions. Renovation-driven displacement pushes that number higher.
Every replacement carries recruiting, onboarding, and productivity-ramp costs. A conservative industry figure is 30–40% of annual salary per replaced position. For a mid-size hotel kitchen team, that's a five- to six-figure line item that never gets attributed to the renovation on the ledger.
Guest Retention and Review-Score Decay
Research from the Cornell Center for Hospitality Research has repeatedly shown that service disruption during a stay correlates with measurable review-score decline and reduced repeat-booking rates. For properties with strong loyalty programs or member bases — private clubs especially — this is where the cost of kitchen renovation downtime becomes strategic rather than operational. A member who cancels their annual renewal because dining was closed for four months isn't recovered by reopening a nicer kitchen.
Brand Drag on Post-Renovation Ramp-Up
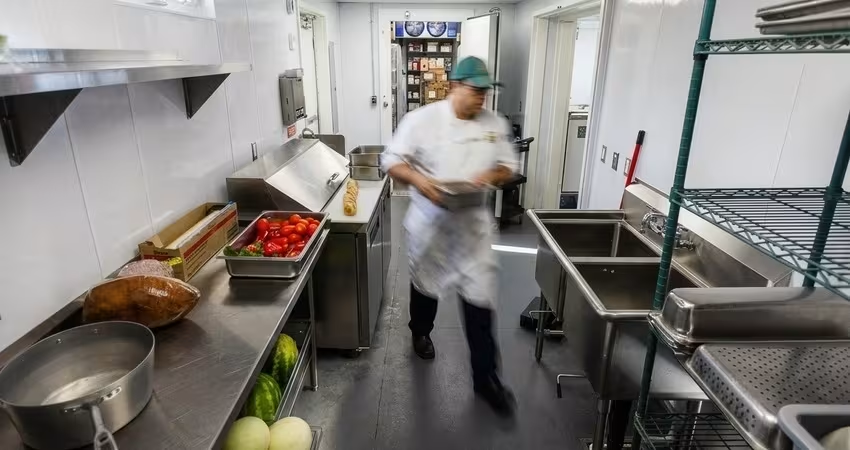
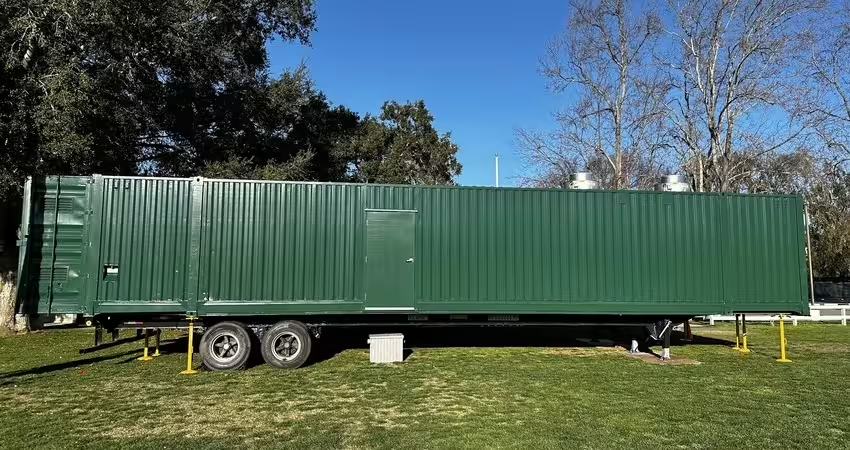
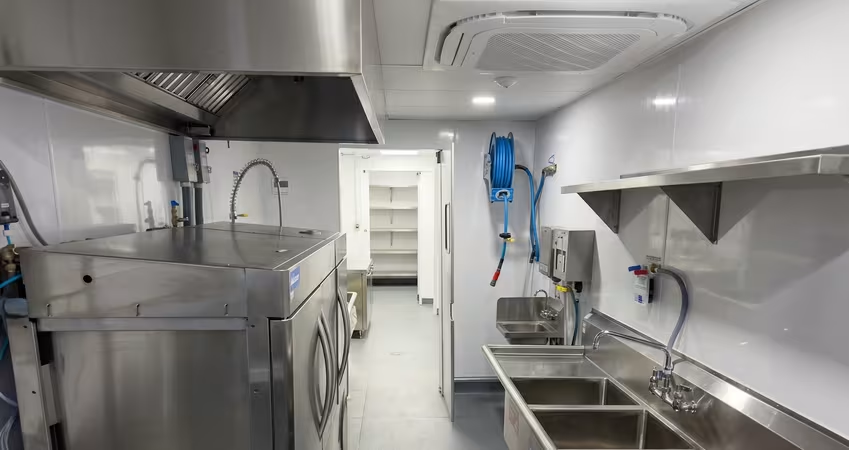
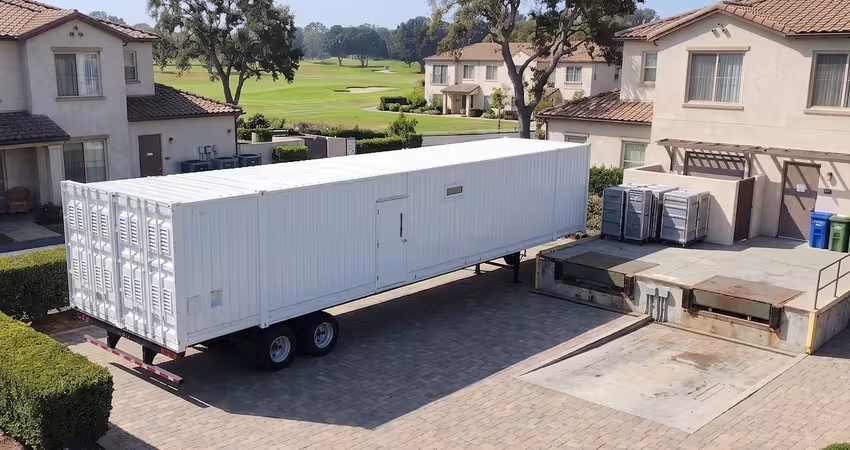
Reopening doesn't reset the clock. Guests need time to relearn that the property is fully operational, marketing has to rebuild demand for the F&B program, and staff need weeks to reach full efficiency. A 90-day renovation frequently produces a 120–150 day full-revenue impact when ramp-up is included honestly. This is where a continuity solution — a purpose-built mobile kitchen deployed during the renovation window — protects both direct revenue and the ramp-up curve. Mobile Culinaire's use-case portfolio illustrates how full-service continuity changes the shape of that curve.

Worked Example: The Kitchen Downtime Cost Calculator in Practice
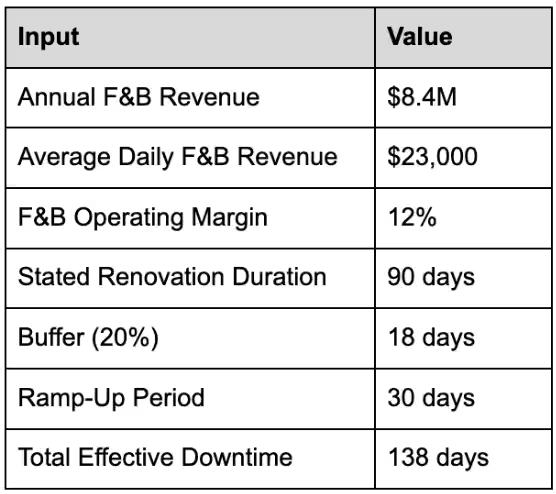
Consider a 120-room full-service resort with a banquet operation and a signature restaurant. Base numbers:
Running the base formula:
Direct Revenue Exposure = $23,000 × 12% × 138 = $380,880
Now layer the multipliers. Assume the resort loses six kitchen staff during closure at an average replacement cost of $18,000 each ($108,000). Assume a 3% guest-retention hit against $8.4M in annual F&B, sustained one year post-reopening ($252,000). Assume ramp-up during the buffer period runs at 50% capacity, adding another $79,000 in soft loss beyond direct exposure.
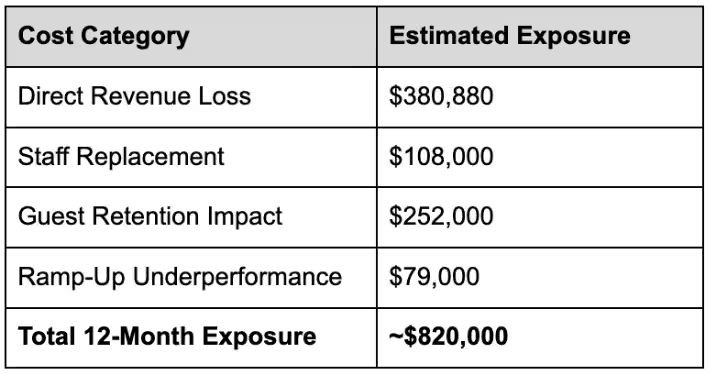
The direct number that shows up in the renovation budget is $380K. The full number is more than double. That gap is exactly what a properly scoped kitchen downtime cost calculator is designed to surface before the decision gets locked in. Our hidden costs of kitchen renovation shutdowns resource explores each multiplier category in additional depth.
Note: These figures are illustrative for a mid-market resort profile. Substitute your own inputs — the arithmetic is straightforward, but the discipline of pulling accurate margin and turnover numbers is what makes the output usable.
How Renovation Timeline Length Changes the Math
The exposure curve isn't linear. Longer renovations disproportionately amplify the multiplier categories — staff loss compounds, review-score decay deepens, and ramp-up gets harder as guests build alternative habits.
Using the same $23,000/day, 12%-margin property:
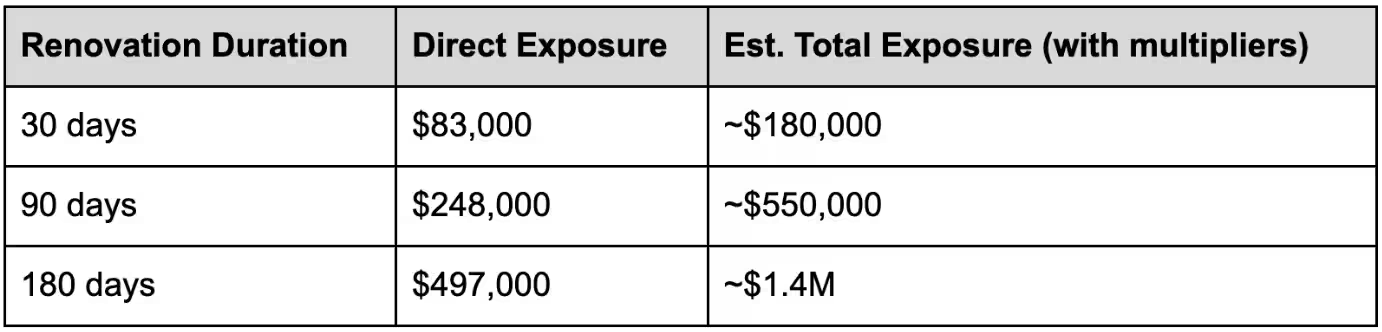
The 30-day column is uncomfortable. The 180-day column is a P&L event that shows up on the property's annual report. The cost of kitchen renovation downtime scales non-linearly, which is why the ROI framing for continuity solutions shifts sharply above 60–90 days — the exposure math starts breaking against the renovation, not for it.
Tip: Run the kitchen downtime cost calculator three times with different duration assumptions — contractor-stated, contractor+20%, and worst-case (contractor+40%). The spread between the three tells you how much your renovation budget needs to hedge.
Building the Business Case: Turning This Calculation Into a Budget Line
Once the exposure number is documented, the F&B revenue continuity planning conversation becomes concrete. Two moves make the number defensible to ownership:
- Sensitize the inputs
Present three scenarios — base, buffered, worst-case — rather than a single point estimate. Ownership responds better to a range with stated assumptions than to a single number with hidden ones.
- Compare against continuity cost
The exposure number is only useful if it's set next to what continuity actually costs. For most mid- to long-term renovations, a purpose-built mobile kitchen rental represents a fraction of the exposure calculated above — our capital cost breakdown shows how continuity fits into the total renovation budget.
For the mobile kitchen decision-maker building the internal case, existing project examples show how properties with comparable profiles have handled continuity. The point isn't to sell ownership on a specific vendor — it's to demonstrate that continuity is a solved problem the committee can approve without inventing a framework.
Protecting Revenue During Your Renovation
Every renovation project reaches a point where the continuity decision has to be made — usually earlier than teams realize. If your kitchen downtime cost calculator output produces a number that makes ownership uncomfortable, the next step is to compare it against a continuity plan built for your specific project window.
Mobile Culinaire offers customized downtime exposure reviews for hotels, resorts, country clubs, and senior living operators planning renovations. Provide your daily F&B revenue, margin, and projected renovation window, and we'll return a side-by-side exposure vs. continuity comparison specific to your property. Request a customized review or explore the mobile kitchen product line to see what a purpose-built continuity solution looks like.
Disclaimer
The calculations and industry figures above are provided for planning purposes and reflect general industry benchmarks as of publication. Individual property economics vary substantially by market, service model, and operating structure. Consult your finance team, tax advisor, and construction planning partners before finalizing renovation budgets or business case decisions. All third-party data cited reflects sources current as of the time of writing.
People Also Ask (FAQ)
How do you calculate revenue loss from kitchen downtime?
The base kitchen downtime cost calculator multiplies your average daily F&B revenue by your F&B operating margin, then by total downtime days. Total downtime should include the stated renovation duration, a schedule-slip buffer of 15–25%, and a post-completion ramp-up period during which the kitchen operates below full capacity. For a fuller picture, layer in staff replacement costs, guest retention impact, and post-renovation demand rebuild — these routinely double the direct exposure figure.
What is the average cost per day of a closed commercial kitchen?
There's no single industry-wide number because F&B revenue varies dramatically by property size, service model, and market. For hotels and resorts, daily F&B revenue commonly ranges from $10,000 for a limited-service operation to $50,000+ for a full-service resort with active banquet business. Apply your property's operating margin (typically 10–20% for hotel F&B) to that daily revenue to get direct exposure per closed day, then add multipliers for the full picture.
How long does a typical hotel or resort kitchen renovation take?
Hospitality kitchen renovations typically run 60–180 days depending on scope. A cosmetic refresh with equipment swaps completes in 30–60 days. A full gut renovation with layout changes, MEP upgrades, and permit inspections routinely runs 90–150 days. Complex projects involving structural work or code-driven upgrades can extend past six months. Industry reporting suggests 15–25% schedule overruns are common, so buffer plans accordingly.

%20(1).avif)
Testimonial

"What is standing out when you look at the mobile kitchen operation is the efficiency that we can really achieve because it's built for that."
Tell us about your kitchen needs and request a quote.
.png)
Turnkey mobile kitchen
Proudly made in-house in the USA
Commercial grade kitchen equipment
Code-compliant
Trusted by Industry Leaders